Using the Documentation Browser
- Scott Saccone
Topics on this Page
BioQ provides a number of tools for browsing database documentation. The documentation browser for a particular database, such as the 1000 Genomes IP1 Release database, can be accessed from BioQ home page.

The Documentation Home Page
The documentation home page for a database, such as 1000 Genomes IP1 Release, provides the complete list of tables for that database as well as a number of other logical groupings such as the Categories and Processes sections.

Tables and Columns
Documentation on specific tables, such as the 1000 Genomes asw_vfreq table, can be found by clicking on the table's link in the Tables section.

This brings you to a new page with detailed information on the table, including a possibly more detailed description of the table and a complete list of columns. Hyperlinked columns can be clicked for more detailed information on a single column. The Browse Data button allows you to view data from the table in the BioQ query tool - click here to browse the asw_vfreq table.

Tracing Experimental Process Flow
The documentation page for a table includes a graphical view of experimental process flow. The Back Trace section traces experimental process flow back from the table to other tables and processes while the Full Trace shows bidirectional flow. For key results in the database, such as allele frequency estimates in the 1000 Genomes project and linkage disequilibrium estimates in the HapMap project, ideally we want to trace this data back to the original biologics and subjects.
The following screenshot is from the documentation page for the allele table from the Ensembl Variation database. The table being traced is shown in green.
A legend for process flow diagrams can be found by clicking the Show/Hide Legend text just below the Back Trace section.

We call this the Biologic-Experiment-Result (BERT) model for tracing experimental process flow. The idea is to identify the various processes that lead to the data in the databases. Examples include sample collection, genotyping, sequencing, quality control assessment, and various analyses that lead to the primary results in the database. Tables that represent key results in the database are labeled with an "R". Tables are grouped into "Flow Groups" that can be input or output for processes in the database. Processes that represent an actual experiment with some kind of conclusion are labeled as "E". Ideally we want to trace the results in the database back through these experiments and various processes to the original biologics and subjects; we label these tables "B" and "S", respectively. You can click any node in the diagram for more detailed information on tables, flow groups and processes. See this page for additional information on the BERT model and its implementation in BioQ.
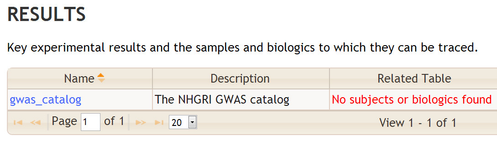
The documentation home page for a database contains a Results section that lists tables identified as "results" in the BERT model. For each results table, this section lists all the subject and biologic tables to which the results table can be traced. The following is an example from the 1000 Genomes Project.

When results cannot be trace back to subjects and biologics BioQ will show a warning in red, as shown in this example from the NHGRI GWAS database: