/
Tour
Tour
A Tour of BioQ
BioQ is a web application for retrieving data from genomic relational databases. It provides detailed documentation and powerful query tools. It also allows you to download all the data from the databases in multiple formats.
The following is a brief tour showing BioQ's basic features. Click on a thumbnail for a larger image. Move the mouse to the left and right boundaries of the enlarged image and click the arrows that appear in order to navigate. See the User's Guide and Technical Guide for more detailed information.
|
|
|
|
|
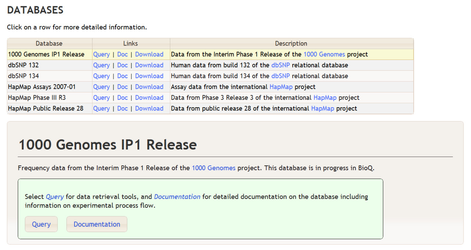
Select a database to get started.
|
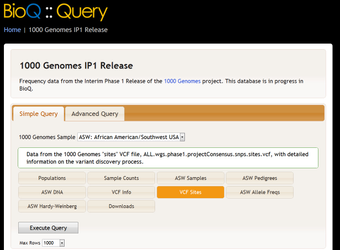
Select a simple query.
|
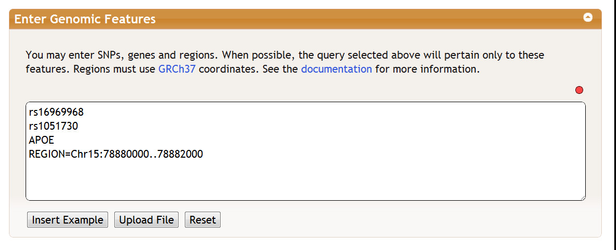
Querying the database for specific genes and regions (only pertains to certain queries).
|
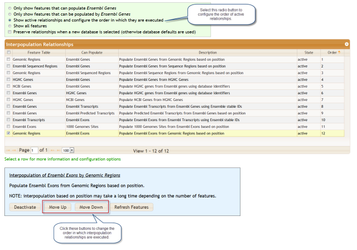
You may configure how genomic features are automatically selected from one another
|
|
|
|
|
|
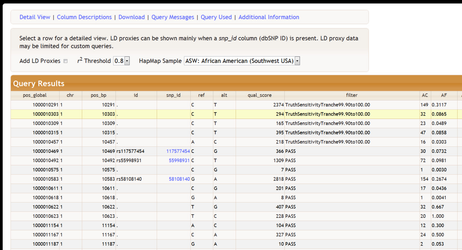
View query results in an interactive table.
|
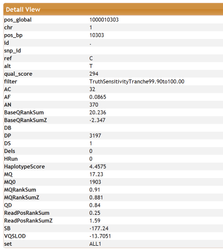
Select a row from the query results for a detailed view.
|
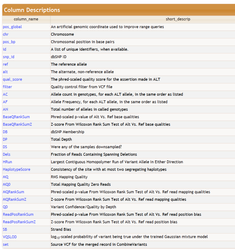
Brief descriptions of column with links to documentation tool for additional information.
|
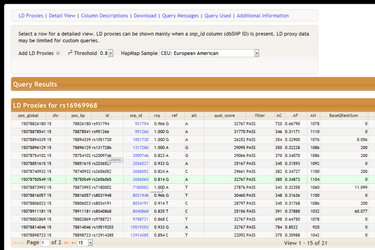
View linkage disequilibrium (LD) proxies in selected populations for variant-related queries.
|
|
|
|
|
|
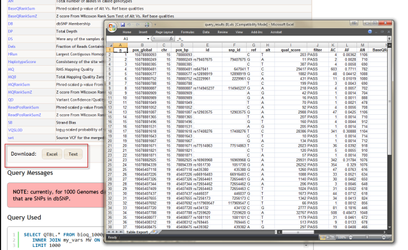
Download query results in Text and Excel formats.
|
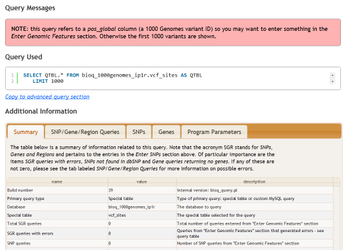
View the query used. You can also copy it into the advanced query tool and customize the query.
|
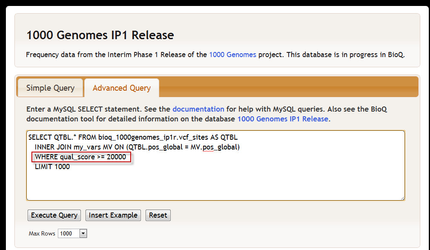
The powerful custom query tool. Here the results from a simple query are filtered by a quality control measure.
|
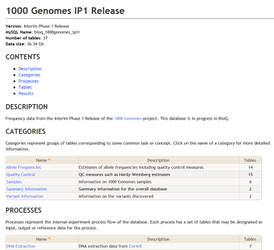
Database documentation with logical groupings of tables.
|
|
|
|
|
|
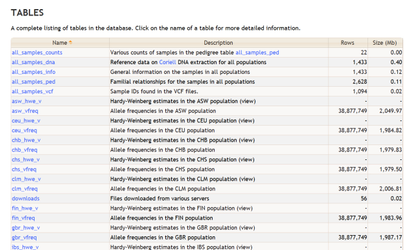
Complete table listings with brief descriptions in an interactive table.
|
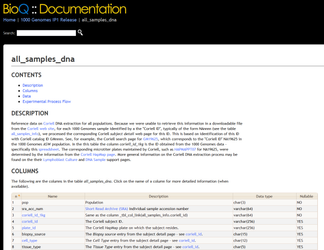
Detailed documentation for a single table with brief descriptions of rows.
|
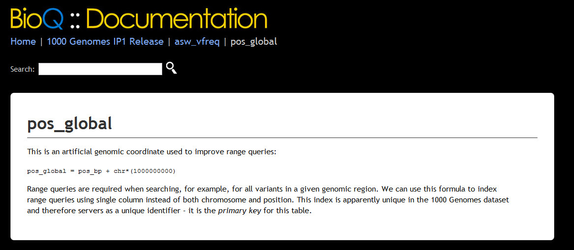
Detailed documentation for a single column.
|
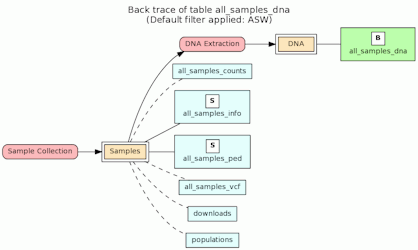
Tracing experimental process flow back to the original samples and biologics in an interactive diagram.
|
|
|
|
|
|
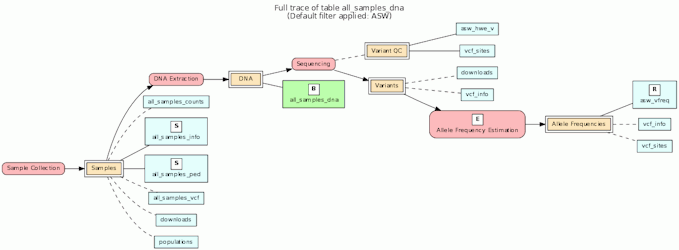
A full trace showing bidirectional experimental process flow
|
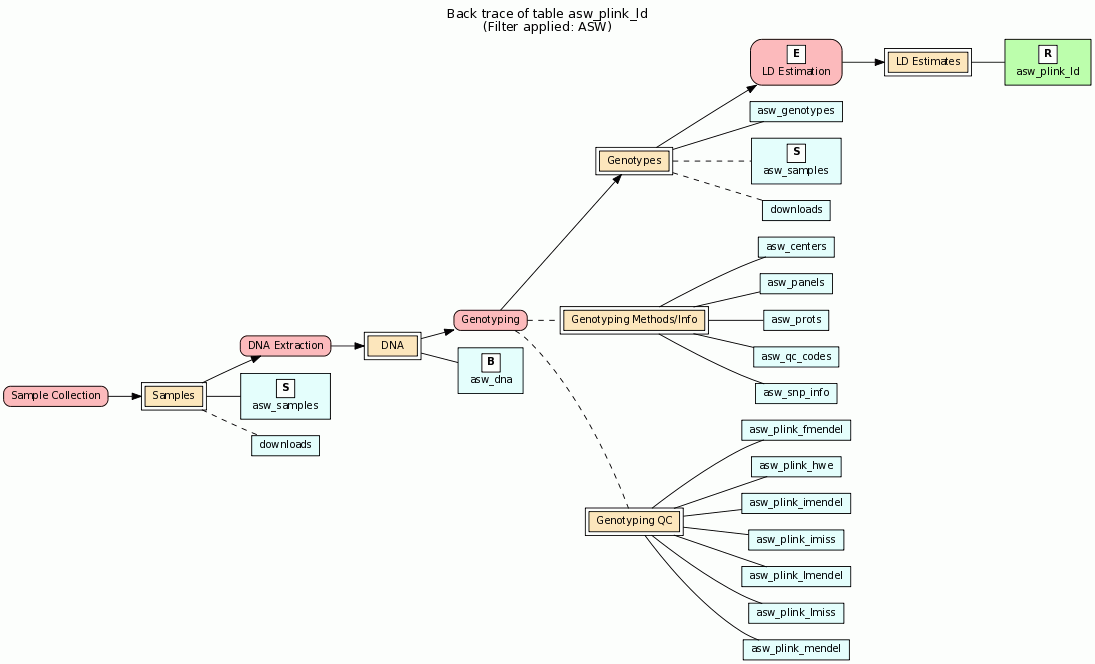
Another trace showing experimental process flow for LD estimates in the HapMap database.
|
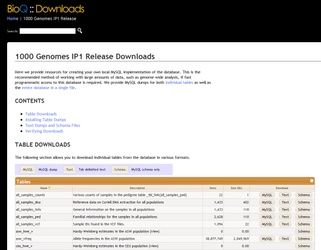
Tables may be downloaded in text and MySQL "dump" formats.
|